- Posted on
- admin
- No Comments
Trino Architecture Explained
Running your first query against Trino feels almost anticlimactic. You type SQL, you get a result back, it looks exactly like querying any other database. What’s actually happening between those two moments, though, is a small distributed system assembling itself on the fly: a query gets parsed, analyzed, planned, broken into a tree of stages, scattered across a cluster of workers as thousands of parallel tasks, and stitched back together, all before you’ve finished reading the result set.
If you’re new to Trino entirely, our complete beginner’s guide to Trino covers the basics and a hands-on quickstart first. This piece goes deeper, into the internals that explain why Trino behaves the way it does under load: the coordinator and worker roles, the full query planning pipeline, how stages and tasks actually execute, dynamic filtering, memory management and spilling, fault-tolerant execution, and workload management through resource groups.
The High-Level Shape of a Trino Cluster
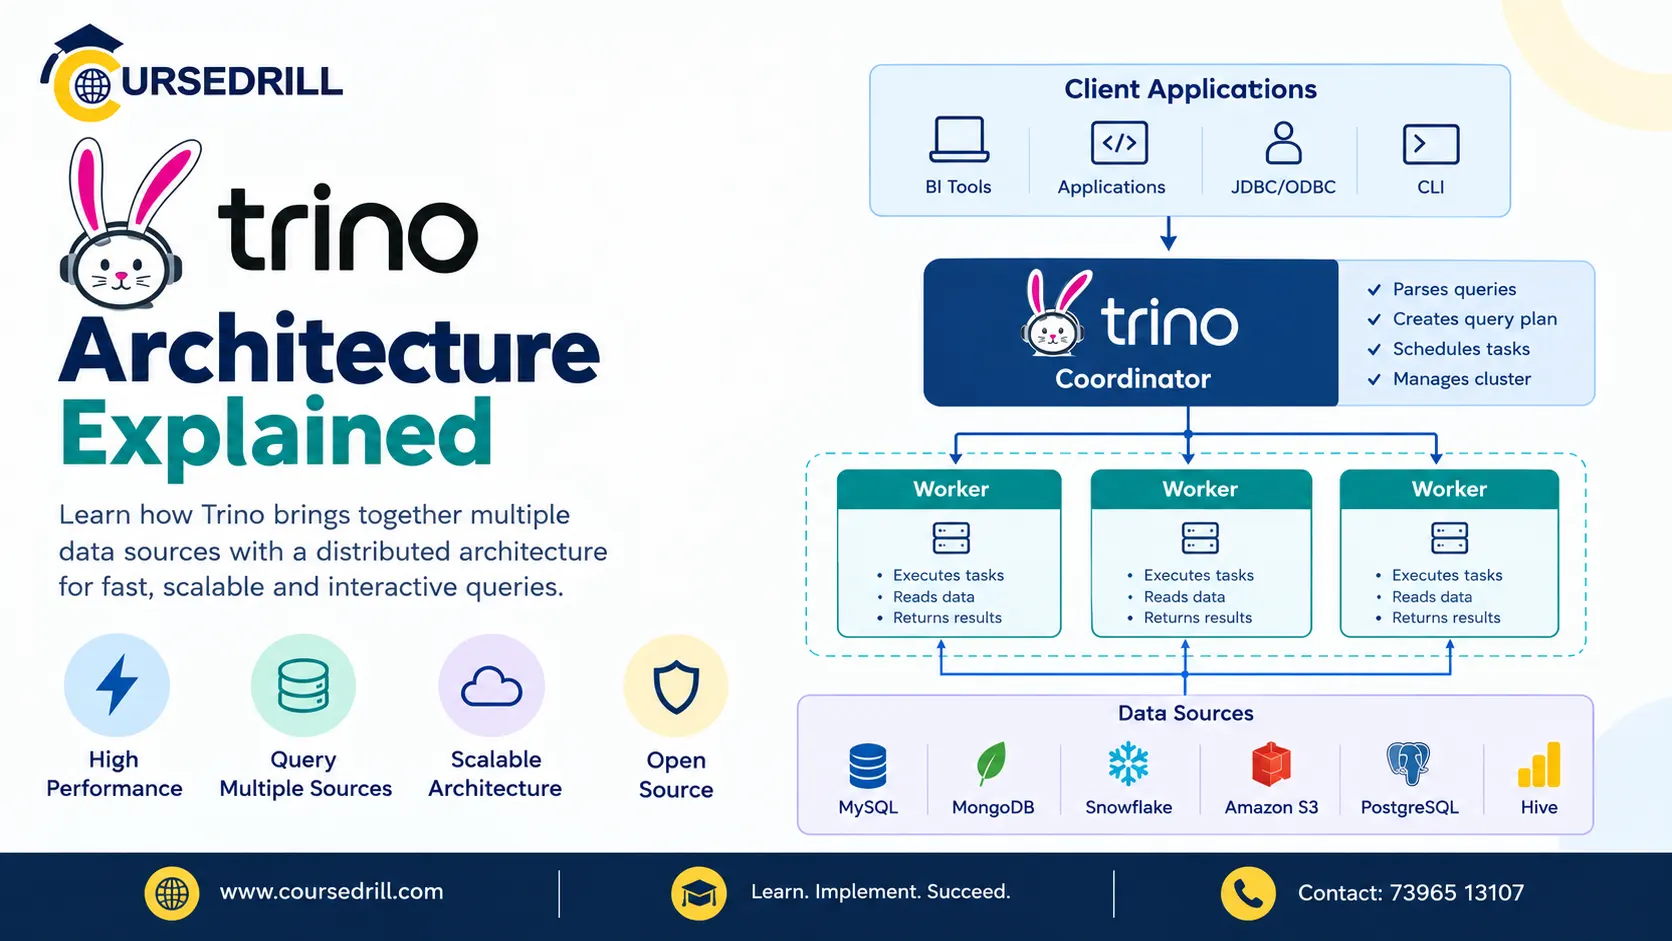
Before the details, the overall structure is worth having fixed in your head:
                     ┌─────────────────────┐
   Client (CLI/BI) ─▶│      Coordinator     │
                     │  parse / analyze /   │
                     │  plan / schedule     │
                     └──────────┬───────────┘
                                │ HTTP (tasks, splits)
                 ┌──────────────┼──────────────┐
                 ▼              ▼              ▼
           ┌───────────┐  ┌───────────┐  ┌───────────┐
           │  Worker 1 │  │  Worker 2 │  │  Worker 3 │
           │  tasks /  │  │  tasks /  │  │  tasks /  │
           │  drivers  │  │  drivers  │  │  drivers  │
           └─────┬─────┘  └─────┬─────┘  └─────┬─────┘
                 │              │              │
                 ▼              ▼              ▼
           Connector A     Connector B     Connector C
        (Hive / Iceberg)   (PostgreSQL)      (Kafka)
(cite index=”26-1″>Trino uses HTTP for all communication, both internal and external, which is part of what keeps the architecture relatively easy to reason about and debug compared to systems built on custom binary protocols. A single coordinator sits at the top, one or more workers do the actual data processing underneath, and connectors sit at the very bottom, translating Trino’s query model into whatever protocol the underlying data source actually speaks.
The Coordinator: Planning, Not Processing
(cite index=”17-1″>The Trino coordinator is the server responsible for parsing statements, planning queries, and managing worker nodes. It’s the “brain” of a Trino installation and the node a client connects to when submitting statements for execution.
Critically, the coordinator generally doesn’t process data itself, its job is orchestration. (cite index=”25-1″>It acts as the brain of the cluster: when a user submits a SQL query, the coordinator parses the statement, analyzes the syntax, and plans the execution, creating a logical model of the query and transforming it into a series of physical stages that can be distributed across the workers. The coordinator also manages the discovery service, which keeps track of active workers and their available resources.
That discovery service is worth understanding on its own, since it’s what makes the cluster self-organizing rather than requiring a static list of workers configured by hand. (cite index=”26-1″>The coordinator hosts a discovery service that all nodes use to find each other.
Every Trino instance registers itself with the discovery service on startup and continuously sends heartbeats to keep its registration current, and the discovery service shares the same HTTP server and port as Trino itself. A worker that stops heartbeating gets dropped from the pool the coordinator schedules work onto, which is part of how the cluster detects and routes around a dead node.
The Workers: Where the Actual Processing Happens
(cite index=”25-1″>Worker nodes are the muscle that perform the actual data processing. Each worker connects to underlying data sources via Trino connectors, fetches the required data, and processes it in memory. Workers execute the tasks assigned by the coordinator, filtering, joining, and aggregating data, and to maintain high performance, they stream data to one another in parallel stages, minimizing the time the coordinator spends assembling the final result.
That last detail matters more than it might seem. The coordinator isn’t a bottleneck that every row of data has to pass through, workers exchange intermediate results directly with each other over the network, and the coordinator mostly just needs the final, already-aggregated output.
Connectors and the Three SPIs
Connectors are how Trino stays agnostic about what it’s actually querying, and they’re built around three distinct interfaces that map cleanly onto the three questions the coordinator needs answered during planning.
(cite index=”47-1″>The Parser and Analyzer look at the Metadata SPI to get information about tables, columns, and types. The Planner and Optimizer look at the Data Statistics SPI to get information about row counts and table sizes to perform cost-based query optimizations during planning. The Scheduler looks at the Data Location SPI, which facilitates creation of the distributed query plan by generating the logical splits of the table contents, the smallest unit of work assignment and parallelism.
In plain terms: a connector tells Trino what tables and columns exist (Metadata SPI), roughly how big they are so the optimizer can make good decisions (Data Statistics SPI), and where the actual data physically lives so work can be divided up and assigned to workers (Data Location SPI). A connector doesn’t need to implement every capability perfectly,
some connectors provide rich statistics that unlock better join ordering, others provide only the bare minimum needed to scan data, and query performance against that source reflects that difference directly.
How a Query Actually Gets Planned
This is the part most tutorials skip past, but it’s where a lot of Trino’s behavior, and a lot of its performance, actually gets decided.
(cite index=”41-1″>The Parser parses the SQL query into an abstract syntax tree (AST). The Analyzer then checks for valid SQL, including functions and column references, requesting metadata about structure from catalogs and metadata about content, like table statistics and data location.
From there, the optimizer eliminates redundant conditions, figures out the best order of operations, and decides on filtering as early in the plan as possible, before creating a distributed plan that breaks the logical plan into pieces adapted for parallel access by multiple workers.
Put as a pipeline, a query moves through roughly these stages:
- Parsing — SQL text becomes an abstract syntax tree.
- Analysis — the AST gets checked against catalog metadata: do these tables and columns exist, are the types compatible, is the syntax actually valid.
- Logical planning — an internal, engine-agnostic representation of what the query needs to do, joins, filters, aggregations, gets built and optimized, using cost-based decisions informed by table statistics where available.
- Distributed planning — (cite index=”47-1″>the logical plan gets broken up into a series of fragments, adapted so that operations are split across workers, with some operations designed so that workers can aggregate and process data received from other workers rather than needing to see the entire dataset locally.
- Scheduling — the coordinator asks each relevant connector for the list of splits available for a table, then assigns those splits to workers to execute in parallel.
You can watch this pipeline’s output directly rather than taking it on faith. (cite index=”43-1″>Running EXPLAIN (TYPE DISTRIBUTED) on a query shows the distributed plan in text form, split into fragments, explicitly showing the data exchange happening between workers, fragment boundaries, output partitioning, and estimated row counts and costs at every step.
For anyone doing serious performance tuning, EXPLAIN is the single most useful tool for understanding why a specific query is slow, since it shows exactly which join strategy, distribution type, and filter pushdown decisions the optimizer actually made.
Stages, Tasks, Splits, and Drivers: The Execution Model
Once planning finishes, the distributed plan gets turned into something that actually runs across the cluster, and this is where the terminology gets more granular.
A stage represents one node in that fragment tree, a coherent unit of the overall query plan. (cite index=”21-1″>A query encompasses stages, tasks, splits, connectors, and other components working together to produce a result, and when Trino executes a query, it breaks execution up into a hierarchy of stages resembling a tree, where a root stage aggregates the output of several child stages, each implementing a different section of the distributed plan.
A task is a stage’s actual unit of execution on a specific worker. (cite index=”20-1″>A stage is implemented as a series of tasks distributed over a network of Trino workers, and tasks are the “work horse” of the architecture, since a distributed query plan is deconstructed into stages, which get translated into tasks, which then act on splits.
A split is the smallest chunk of data a task actually chews through. (cite index=”19-1″>A split is a smaller part of a target dataset defined by the connector, and when scheduling a query, the coordinator asks a connector for a list of all the splits available for a table, then hands those splits out across available workers so a billion-row scan becomes thousands of small, independently processable pieces running in parallel rather than one long sequential read.
Underneath a task sits a driver, the actual thread-level unit of execution, running a pipeline of operators, filters, joins, aggregations, chained together to process the data flowing through that particular split. Where drivers on different workers need to share data with each other, that happens through an exchange, either a local exchange for redistributing data between drivers on the same node, or a remote exchange for shipping intermediate results across the network between stages.
Memory Management and Spilling
Because Trino aims for interactive, in-memory execution, memory pressure is a real operational concern, and the platform gives you a few different levers to manage it.
(cite index=”45-1″>Memory configuration properties control the total memory available for queries across the cluster, the total memory per query including revocable memory, and the memory limit per node for a single query. (cite index=”42-1″>By default, Trino kills queries if the memory requested by execution exceeds configured session limits, a mechanism that ensures fairness in memory allocation across concurrent queries and prevents deadlocks caused by memory contention.
For memory-intensive operations that would otherwise fail outright, (cite index=”42-1″>Trino supports offloading intermediate operation results to disk, similar in spirit to OS-level page swapping but implemented at the application level for Trino’s specific needs. The concept of revocable memory lets a query request memory that doesn’t count toward hard limits, but which the memory manager can revoke at any time, forcing the query to spill intermediate data to disk and continue processing later.
A query forced to spill this way may run orders of magnitude slower than one that completes entirely in memory. (cite index=”42-1″>This legacy spill-to-disk mechanism is generally considered less preferable today, with fault-tolerant execution and its task retry policy recommended as the modern alternative for handling large, memory-heavy queries reliably.
That’s a useful distinction to internalize: spill-to-disk keeps an otherwise-doomed query alive by trading speed for completion, while fault-tolerant execution, covered next, solves a related but different problem, surviving a worker actually failing partway through a long query.
Dynamic Filtering: Pruning Data Before You Scan It
One of the more genuinely clever optimizations in Trino’s execution engine is dynamic filtering, and it’s worth understanding because it explains why some joins run dramatically faster than a naive execution plan would suggest.
(cite index=”54-1″>Dynamic filtering allows connectors to utilize filters pushed into a table scan at runtime. For example, the Hive connector can push dynamic filters into ORC and Parquet readers to perform stripe or row-group pruning, based on the size of the right, or build, side of a join.
Here’s the intuition: imagine joining a small dim_date table filtered down to just one month against a massive, unfiltered fact_sales table. Without dynamic filtering, Trino would need to scan the entire fact_sales table before the join could eliminate the rows that don’t match. With dynamic filtering, Trino first evaluates the small side of the join, builds a compact filter representing the actual values present, d_date_sk values for that one month, and pushes that filter down into the scan of the large table before it’s even fully read, sometimes letting Parquet or ORC readers skip entire row groups or file stripes without decompressing them at all.
(cite index=”54-1″>You can confirm whether the planner has added dynamic filters to a specific query’s plan by examining its EXPLAIN output directly, where a dynamicFilterAssignments entry on the scan operator shows the optimization actually took effect.
Fault-Tolerant Execution: Surviving Worker Failures
By default, Trino’s execution model is genuinely unforgiving of failure. (cite index=”33-1″>The default all-or-nothing architecture makes fault tolerance difficult by design: because Trino uses streaming exchange, all tasks within a query are interconnected, so a failure of any single task results in the entire query failing. (cite index=”38-1″>If a Trino node lacks the resources to execute a task or otherwise fails during execution, the query fails and has to be resubmitted manually, and the longer a query runs, the more exposed it is to exactly this kind of failure.
Fault-tolerant execution exists specifically to fix that for long-running queries. (cite index=”38-1″>It’s a mechanism that lets a cluster mitigate query failures by retrying queries or their component tasks when they fail. With it enabled, intermediate exchange data gets spooled to external storage and can be reused by another worker if the original one goes down mid-query.
There are two retry policies, and they’re meant for genuinely different workloads. (cite index=”34-1″>A QUERY retry policy instructs Trino to retry an entire query automatically when an error occurs on a worker node, and is recommended when the majority of a cluster’s workload is many small queries. A TASK retry policy instructs Trino to retry individual query tasks rather than the whole query, and is recommended for large batch queries, since the cluster can more efficiently retry just the smaller failed piece rather than redo everything from scratch.
The TASK policy requires a supporting piece of infrastructure to actually work: (cite index=”34-1″>an exchange manager, which stores and manages spooled data for fault-tolerant execution, using external storage such as Amazon S3, S3-compatible systems, or HDFS to hold spilled data beyond what fits in an in-memory buffer. (cite index=”36-1″>The coordinator uses this exchange manager to buffer data during query processing in that external location, and if a worker fails partway through, for a network outage or resource exhaustion, the coordinator simply reschedules that failed piece of work on another worker, continuing query processing using the buffered data rather than starting over.
Worth knowing before you flip this on: (cite index=”31-1″>fault tolerance does not apply to broken queries or other user error, Trino doesn’t waste resources retrying a query that fails because its SQL can’t be parsed, and (cite index=”31-1″>support for fault-tolerant execution varies on a per-connector basis, so setting a retry policy may cause queries against unsupported connectors to fail outright with an explicit “this connector does not support query retries” error rather than silently falling back to the old behavior.
Resource Groups: Managing Multi-Tenant Workloads
A production Trino cluster is rarely serving just one workload. Analysts running ad-hoc exploratory queries, scheduled ETL jobs, and BI dashboards all tend to share the same cluster, and without any workload isolation, one runaway query can starve everything else.
(cite index=”58-1″>Resource groups are arranged in a hierarchical tree. Root groups sit at the top level, a group with sub-groups is called a parent group, and a group without sub-groups is a leaf group, where only leaf groups can actually accept queries. You can set limits per group, memory usage, CPU time, and the number of concurrent queries, and when those limits are reached, new queries get queued rather than immediately failing or contending for resources.
(cite index=”50-1″>Selectors determine which queries land in which resource group, matching on properties like the submitting user, the query’s declared source, or client-provided tags. Templates allow administrators to construct resource group trees dynamically, for example expanding a variable like ${USER} into the actual username of whoever submitted the query, so a single template rule can generate a separate per-user sub-group automatically rather than requiring one manually defined group per person.
In practice, this is how platform teams keep a shared cluster fair: a heavyweight nightly ETL job gets its own resource group with a generous memory allowance and low concurrency, while ad-hoc analyst queries share a separate pool capped tightly enough that one bad query can’t take down everyone else’s dashboard.
Security as Part of the Architecture
Security isn’t bolted onto Trino as an afterthought, it’s a defined layer with its own set of pluggable mechanisms sitting alongside the query engine itself: TLS for encrypting traffic, multiple supported authentication types including LDAP, Kerberos, OAuth 2.0, and JWT, and a system access control layer that can be backed by simple file-based rules or delegated to an external policy engine like Open Policy Agent or Apache Ranger for more centralized, auditable permission management across a whole organization’s catalogs.
The architectural point worth taking away here: access control decisions get evaluated at the coordinator and connector layer, before data ever reaches a client, which is what lets Trino enforce row- and column-level restrictions consistently even when the same underlying data is being federated in from multiple different backend systems with their own, potentially inconsistent, native permission models.
Deployment Considerations Worth Knowing
A couple of practical architectural realities are worth flagging for anyone planning an actual production deployment rather than just a local experiment.
The coordinator is architecturally singular. A standard Trino cluster runs exactly one coordinator, which is a natural point of failure if it goes down, since new queries can’t be submitted or scheduled without it, even though already-running queries and worker-to-worker exchanges continue independently for a while. Larger deployments commonly address this by running a gateway layer, Trino Gateway is one open-source option, in front of multiple independent Trino clusters, routing queries and managing resource groups centrally across clusters rather than relying on Trino’s own coordinator for that redundancy.
Worker scheduling also isn’t blind to data locality where a connector can express it. Where a connector’s Data Location SPI can indicate that certain splits are more efficiently read from certain nodes, the scheduler favors keeping computation close to that data, though for connectors backed by remote object storage like S3, this locality awareness matters far less than it did in Trino’s Hadoop-era origins, since there’s no single “close” node to a cloud storage bucket in the first place.
Frequently Asked Questions
What’s the difference between a stage, a task, and a split in Trino? A stage is a logical part of the overall query plan, roughly one node in a tree of operations. A task is that stage’s actual execution on a specific worker. A split is the smallest chunk of the underlying dataset a task processes, letting a large table scan be broken into many parallel, independently schedulable pieces.
Does the coordinator process any query data itself? Generally no. The coordinator’s job is parsing, analysis, planning, and scheduling, along with running the discovery service that tracks active workers. The actual data processing, scanning, filtering, joining, and aggregating, happens on worker nodes, which stream intermediate results directly to each other rather than routing everything back through the coordinator.
What is dynamic filtering and why does it matter? Dynamic filtering lets Trino evaluate the smaller side of a join first, then push a compact filter based on those actual values down into the scan of the larger table, sometimes letting file formats like ORC and Parquet skip entire row groups without reading them. It can dramatically speed up joins where one side of the join is much smaller and more selective than the other.
When should I use fault-tolerant execution? It’s most valuable for long-running batch or ETL-style queries, where a worker failure partway through would otherwise mean restarting the entire query from scratch. For a workload made up mostly of many small, fast interactive queries, the QUERY retry policy or simply not enabling fault tolerance at all is often sufficient, since a full query restart is cheap when the query itself only takes seconds.
What’s the practical difference between the QUERY and TASK retry policies? QUERY retries the entire query from the start if any part of it fails, which is fine for short queries but wasteful for long ones. TASK retries only the specific failed piece of work using data spooled to an external exchange manager, which is far more efficient for large batch queries but requires that exchange manager infrastructure to be configured first.
How do resource groups prevent one bad query from affecting others? Resource groups let administrators define a hierarchical tree of memory, CPU, and concurrency limits, with selector rules routing incoming queries into the appropriate group based on the submitting user, source application, or client tags. A runaway or overly heavy query in one group gets constrained to that group’s limits rather than being able to consume resources that other groups, and other users, depend on.
Is the Trino coordinator a single point of failure? Architecturally, yes, a standard cluster runs exactly one coordinator, and new query submission depends on it being available. Production deployments at larger scale commonly address this with a gateway layer routing across multiple independent Trino clusters, rather than relying on coordinator-level redundancy within a single cluster.
Putting It All Together
Trace one query through everything covered here, and the whole picture clicks into place: SQL text arrives at the coordinator and becomes an AST, the analyzer checks it against catalog metadata, the optimizer builds and refines a logical plan using whatever statistics the connector can provide, the distributed planner breaks that plan into a tree of stages, the scheduler asks connectors for splits and hands them out to workers, and those workers execute tasks made of drivers and operators, exchanging intermediate results with each other,
applying dynamic filters where the plan calls for them, spilling to disk or leaning on fault-tolerant execution if memory or a worker failure gets in the way, all while resource groups keep the whole thing fair across whoever else is sharing the cluster at the same time.
None of that complexity is visible from the trino> prompt, which is precisely the point. For the authoritative, continuously updated reference on every concept covered here, Trino’s official documentation is the best place to go deeper, particularly the admin section covering fault-tolerant execution, resource groups, and dynamic filtering in full configuration detail.
For more breakdowns of open-source data infrastructure and DevOps tooling like this one, keep exploring the guides on CourseDrill.
Popular Courses