- Posted on
- admin
- No Comments
What is OpenTelemetry? Complete Beginner's Guide
What is OpenTelemetry? This beginner’s guide explains traces, metrics, logs, and how OpenTelemetry gives you vendor-neutral observability.
If you’ve ever had a slow API endpoint in production and no real way to figure out which of the six services involved was actually the bottleneck, you’ve felt the exact problem OpenTelemetry exists to solve. So what is OpenTelemetry, and why has it become the default answer to “how do we instrument our systems” across the industry? This guide walks through everything a beginner needs to know, from the core concepts to a working code example.
What is OpenTelemetry?
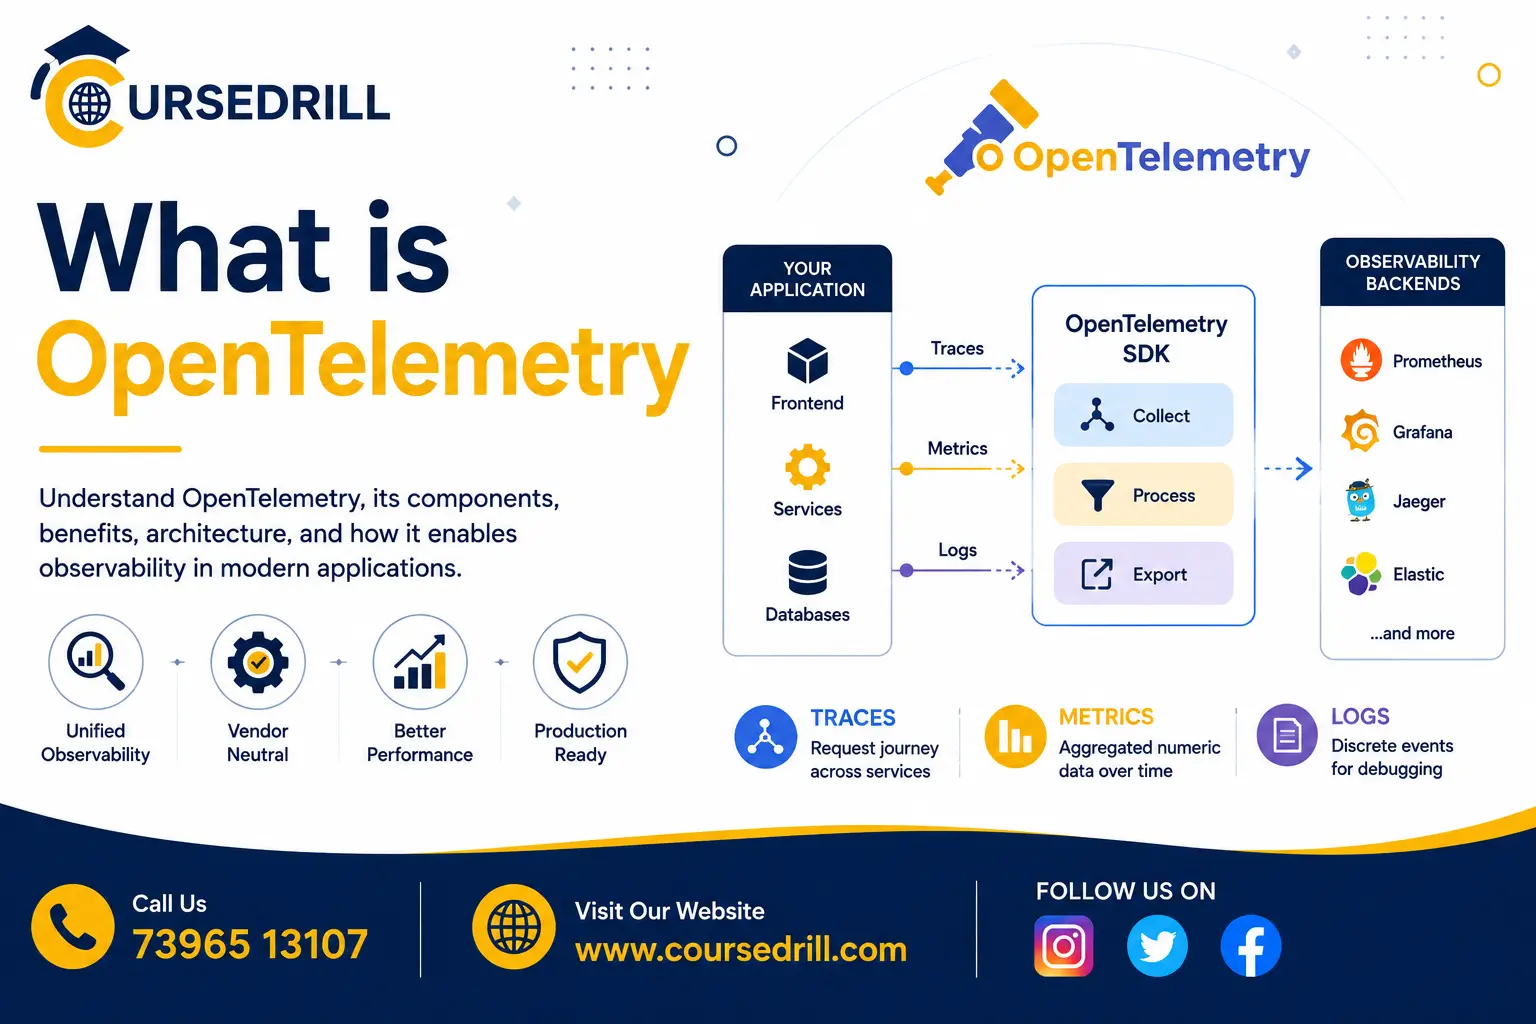
OpenTelemetry, often shortened to OTel, is an open-source observability framework for generating, collecting, and exporting telemetry data, traces, metrics, and logs, from your applications and infrastructure. It provides a vendor-neutral set of APIs, SDKs, and tools so you can instrument your code once and send that data to whichever backend you choose, whether that’s an open-source tool like Jaeger or Prometheus, or a commercial platform like Datadog, New Relic, or Honeycomb.
The vendor-neutral part is the key idea. Before OpenTelemetry, instrumenting an application usually meant adding a specific vendor’s proprietary agent or SDK directly into your code. If you later wanted to switch observability vendors, or use two different tools for different purposes, you were often stuck re-instrumenting your entire codebase. OpenTelemetry decouples how you generate telemetry data from where that data ends up, so switching backends becomes a configuration change rather than a code rewrite.
OpenTelemetry is a project under the Cloud Native Computing Foundation (CNCF), the same organization that hosts Kubernetes, and it’s one of the most active projects in the CNCF ecosystem. It was formed by merging two earlier, competing projects, OpenTracing and OpenCensus, combining their communities and technical approaches into a single standard rather than leaving the ecosystem fragmented between two competing specifications.
The Problem OpenTelemetry Solves
To understand why OpenTelemetry matters, it helps to look at what debugging distributed systems looked like before it existed, and honestly, what it still looks like for teams that haven’t adopted proper observability tooling.
In a monolithic application, tracking down a bug is relatively straightforward: you have one codebase, one set of logs, one process to attach a debugger to. In a modern microservices architecture, a single user request might touch a dozen different services, each with its own logs, potentially written in different languages, running on different infrastructure. When something goes wrong, or just runs slowly, figuring out which service actually caused the problem means correlating timestamps across a dozen separate log streams by hand, an approach that doesn’t scale and rarely produces a clear answer quickly.
Beyond the debugging problem, there’s a vendor lock-in problem. Teams that instrumented their code directly with a specific observability vendor’s SDK found themselves locked into that vendor’s pricing and feature set, since ripping out and replacing instrumentation across dozens of services is a genuinely painful, multi-month project most teams avoid until they absolutely have to.
OpenTelemetry addresses both problems at once. It gives you a standard way to instrument code that automatically captures how requests flow across service boundaries (solving the debugging problem through distributed tracing), and it does so in a way that isn’t tied to any single vendor’s backend (solving the lock-in problem through a vendor-neutral protocol and exporter model).
The Three Pillars: Traces, Metrics, and Logs
OpenTelemetry organizes telemetry data into three core types, often called the three pillars of observability.
Traces
A trace represents the full journey of a single request as it moves through your system, potentially across many services. A trace is made up of spans, each span representing a single unit of work, an HTTP call, a database query, a function execution, with a start time, duration, and metadata describing what happened.
Spans are connected in a parent-child relationship, showing exactly how one operation triggered another. If a slow API request is caused by a database query buried three services deep, a trace shows you that entire chain visually, rather than requiring you to manually piece it together from scattered logs.
Metrics
Metrics are numerical measurements collected over time, request counts, error rates, latency percentiles, CPU usage, queue depth. Unlike traces, which capture the detail of individual requests, metrics are typically aggregated, giving you a high-level view of system health and trends over time, well-suited for dashboards and alerting.
Logs
Logs are timestamped, structured or unstructured text records of discrete events. OpenTelemetry’s logging support connects log entries back to the trace and span that was active when the log was written, letting you jump directly from a specific log line to the full distributed trace it was part of, rather than treating logs as an isolated data source disconnected from everything else.
Together, these three pillars give you complementary views of the same underlying system: metrics tell you something is wrong, traces show you where and how it’s connected across services, and logs give you the detailed, specific context around exactly what happened at a given point.
How OpenTelemetry Works: Core Architecture
OpenTelemetry’s architecture is built around a few key components, each with a distinct role.
The API and SDK
The OpenTelemetry API defines the interfaces your application code uses to create traces, spans, and metrics, things like starting a span or recording a counter increment. The SDK is the actual implementation behind that API, handling how telemetry data is processed, batched, and exported. This separation matters for library authors: a library can depend on the lightweight API without forcing every application using that library to also pull in a full SDK implementation.
Instrumentation
Instrumentation is the code that actually generates telemetry data. OpenTelemetry supports two main approaches. Automatic instrumentation uses agents or libraries that hook into common frameworks (web servers, database drivers, HTTP clients) and generate spans and metrics without you writing any manual tracing code yourself. Manual instrumentation involves explicitly adding code to create custom spans or record specific metrics around business logic that automatic instrumentation can’t know about on its own.
Most real projects use both: automatic instrumentation for the common, well-understood parts of the stack (HTTP requests, database calls), and manual instrumentation layered on top for custom business logic worth tracking specifically.
The OpenTelemetry Collector
The Collector is a standalone service that receives telemetry data from your instrumented applications, processes it (filtering, batching, transforming), and exports it to one or more backends. Running a Collector between your applications and your observability backend gives you a single place to manage export configuration, add sampling rules, or route different types of data to different destinations, without touching application code every time you want to change where your telemetry data goes.
The Collector is optional, applications can export telemetry data directly to a backend, but it’s commonly used in production setups because of the flexibility and decoupling it provides.
Exporters
Exporters are the components that actually send telemetry data to a specific backend, whether that’s an open-source tool like Jaeger (for traces) or Prometheus (for metrics), or a commercial observability platform. Because OpenTelemetry standardizes the data format, switching from one backend to another is often just a matter of changing which exporter is configured, without touching your instrumentation code at all.
Key Concepts You’ll Run Into
A few additional terms come up constantly once you start working with OpenTelemetry.
Context propagation is the mechanism that carries trace information across service boundaries, typically through HTTP headers, so that a span created in one service can be correctly linked as a child of a span created in another service that called it. This is what makes distributed tracing actually distributed, rather than a collection of disconnected traces per service.
Resources describe the entity producing telemetry data, the service name, its version, the host it’s running on, giving you the metadata needed to filter and group data meaningfully in your observability backend.
Semantic conventions are OpenTelemetry’s standardized naming rules for common attributes, ensuring an HTTP status code is always recorded under the same attribute name regardless of which language or library generated it. This consistency is what allows tooling and dashboards to work reliably across a polyglot system instrumented by different teams.
Sampling controls what percentage of traces are actually recorded and exported, since capturing every single trace in a high-traffic system can be prohibitively expensive both in performance overhead and storage cost. OpenTelemetry supports several sampling strategies, from simple percentage-based sampling to more sophisticated tail-based sampling that decides whether to keep a trace based on how it actually turned out (an error, or unusually high latency).
A Simple Example: Instrumenting a Python Application
Here’s what basic manual instrumentation looks like in Python, using OpenTelemetry’s SDK:
from opentelemetry import trace
from opentelemetry.sdk.trace import TracerProvider
from opentelemetry.sdk.trace.export import BatchSpanProcessor, ConsoleSpanExporter

trace.set_tracer_provider(TracerProvider())
tracer = trace.get_tracer(__name__)

span_processor = BatchSpanProcessor(ConsoleSpanExporter())
trace.get_tracer_provider().add_span_processor(span_processor)

def process_order(order_id: str):
    with tracer.start_as_current_span("process_order") as span:
        span.set_attribute("order.id", order_id)

        with tracer.start_as_current_span("charge_payment"):
            charge_payment(order_id)

        with tracer.start_as_current_span("reserve_inventory"):
            reserve_inventory(order_id)

def charge_payment(order_id: str):
    pass

def reserve_inventory(order_id: str):
    pass

process_order("order-1001")
This example uses a ConsoleSpanExporter, which just prints spans to the terminal, useful for learning and local development. In a real setup, you’d swap this for an exporter pointing at an actual backend, Jaeger, an OpenTelemetry Collector, or a commercial platform’s endpoint, without changing anything else about how spans are created.
Notice the nested with tracer.start_as_current_span(...) blocks. The charge_payment and reserve_inventory spans automatically become children of the process_order span, since OpenTelemetry tracks the currently active span through context, building the parent-child relationship without you manually passing span references around.
For most common frameworks, you wouldn’t need to write this manual code at all. Installing an automatic instrumentation package for something like Flask, Django, or FastAPI generates similar spans for every incoming HTTP request automatically, with manual instrumentation reserved for the specific business logic you want additional visibility into.
Also Read: How To Learn API Development For Free
OpenTelemetry vs Vendor-Specific SDKs
It’s worth understanding directly why OpenTelemetry has largely displaced proprietary instrumentation SDKs across the industry.
Vendor-specific SDKs (an older Datadog agent’s tracing library, for instance) tie your instrumentation directly to that vendor’s data format and backend. Switching vendors, or even just adding a second tool for a specific use case, means adding an entirely separate instrumentation layer alongside the first.
OpenTelemetry decouples instrumentation from the backend entirely. You instrument your code once, using OpenTelemetry’s standard APIs, and configure exporters to send that data wherever you want, potentially to multiple backends simultaneously if you’re evaluating a new tool or running two systems in parallel during a migration.
This is a significant enough advantage that most major observability vendors, including Datadog, New Relic, Honeycomb, and others, now support OpenTelemetry’s data format natively as a first-class ingestion path, rather than requiring their own proprietary agent. The industry has largely converged around OpenTelemetry as the standard instrumentation layer, with vendors competing on what they do with that data (visualization, alerting, analysis) rather than on how the data gets generated in the first place.
Common Use Cases for OpenTelemetry
OpenTelemetry shows up anywhere teams need visibility into how their systems actually behave in production.
- Distributed tracing across microservices, understanding exactly how a request flows through a complex system and where time is actually being spent
- Application performance monitoring (APM), tracking latency, error rates, and throughput for services in production
- Root cause analysis during incidents, quickly narrowing down which service or dependency is responsible for an outage or degradation
- Infrastructure and container monitoring, collecting metrics from Kubernetes clusters, hosts, and cloud infrastructure alongside application-level telemetry
- Vendor migration and multi-backend setups, sending the same telemetry data to two observability platforms during an evaluation or transition period without double-instrumenting code
- Cost optimization through sampling, controlling exactly how much telemetry data gets stored and analyzed to manage observability platform costs at scale
Benefits of Using OpenTelemetry
Pulling together what makes OpenTelemetry worth adopting:
Vendor neutrality. Instrument once, export anywhere, without being locked into a single observability vendor’s proprietary format or pricing model.
Broad language and framework support. Official SDKs and automatic instrumentation exist for most major languages, Java, Python, Go, JavaScript/Node.js, .NET, Ruby, and others, along with instrumentation packages for popular frameworks in each.
Industry-standard adoption. As a CNCF project with backing from essentially every major observability vendor, OpenTelemetry has become the de facto standard, meaning skills, tooling, and community knowledge built around it transfer across companies and tech stacks.
Unified data model across traces, metrics, and logs. Correlating a specific log line to the exact trace and span it occurred within removes a huge amount of manual detective work during incident investigation.
Flexible deployment via the Collector. Centralizing export configuration, sampling rules, and data routing outside application code makes operational changes far easier to manage across a large number of services.
Challenges and Things to Consider
OpenTelemetry isn’t without real tradeoffs worth knowing about upfront.
Instrumentation still takes real engineering effort, particularly for manual instrumentation around business-specific logic. Automatic instrumentation covers a lot of ground for common frameworks, but meaningful custom observability, tracking specific business metrics or adding rich context to spans, still requires deliberate work from engineering teams.
The ecosystem, while mature for the most popular languages, has varying levels of completeness across less common languages and frameworks. Teams working outside the most widely used stacks may find gaps in automatic instrumentation coverage that require more manual work to fill.
Running your own Collector infrastructure, while optional, adds an additional operational component to manage, monitor, and scale, particularly in high-throughput production environments where the Collector itself needs to handle significant data volume reliably.
Sampling decisions require real thought. Sampling too aggressively risks missing the exact trace you need during an incident investigation; sampling too conservatively can generate more data (and cost) than a team actually needs or can meaningfully analyze.
Frequently Asked Questions About OpenTelemetry
Is OpenTelemetry free to use? Yes. OpenTelemetry itself, the APIs, SDKs, instrumentation libraries, and Collector, is entirely open source and free. Cost typically comes from whichever backend you choose to store and analyze the telemetry data, whether that’s a self-hosted open-source tool or a commercial observability platform.
Do I need to instrument every line of code manually? No. Automatic instrumentation covers common operations (HTTP requests, database queries, popular framework internals) without any manual code. Manual instrumentation is typically reserved for custom business logic or specific operations you want additional visibility into beyond what automatic instrumentation captures.
What’s the difference between OpenTelemetry and Jaeger or Prometheus? OpenTelemetry is the instrumentation and data collection layer, generating and exporting telemetry data. Jaeger and Prometheus are backends, tools that store, query, and visualize that data once it’s been exported. OpenTelemetry can export directly to either of them, or to many other backends, since it isn’t tied to any specific storage or visualization tool.
Can OpenTelemetry replace my existing logging setup entirely? It can, since OpenTelemetry includes logging support that correlates log entries with trace context, but many teams integrate OpenTelemetry alongside an existing logging pipeline rather than replacing it outright, particularly if that pipeline already has established tooling and retention policies built around it.
Is OpenTelemetry only for microservices? No, though it’s particularly valuable there given how much harder debugging becomes across service boundaries. Monolithic applications benefit too, from detailed traces showing exactly where time is spent within a single request’s handling, and standardized metrics collection regardless of your architecture.
How mature is OpenTelemetry for production use? Very mature for tracing and metrics, which have both reached stable, generally-available status across most major language SDKs. Logging support has matured significantly and is production-ready in most SDKs as well, though it was historically the newest of the three pillars to stabilize, so it’s worth checking current status for your specific language if logging is a primary use case.
Wrapping Up
So, what is OpenTelemetry, in a single sentence? It’s the open, vendor-neutral standard for instrumenting your applications to produce traces, metrics, and logs, decoupling how you generate telemetry data from where you send it, so you’re never locked into a single observability vendor just because of how your code happens to be instrumented.
For any team running distributed systems, which today means most teams running more than a handful of services, OpenTelemetry has become less of an optional nice-to-have and more of a baseline expectation. It won’t replace the actual work of building good dashboards, setting sensible alerts, or thinking carefully about what to monitor, but it removes the instrumentation lock-in problem that used to make switching observability tools a genuinely painful, multi-month undertaking.
For deeper technical reference as you get started, the official OpenTelemetry documentation covers language-specific getting-started guides, Collector configuration, and semantic conventions in far more depth than a single beginner’s guide can.
Popular Courses