- Posted on
- admin
- No Comments
Dagster Tutorial: A Beginner's Guide
This Dagster tutorial for beginners walks through installation, your first data asset, jobs, schedules, and the Dagster UI, with a full working example.
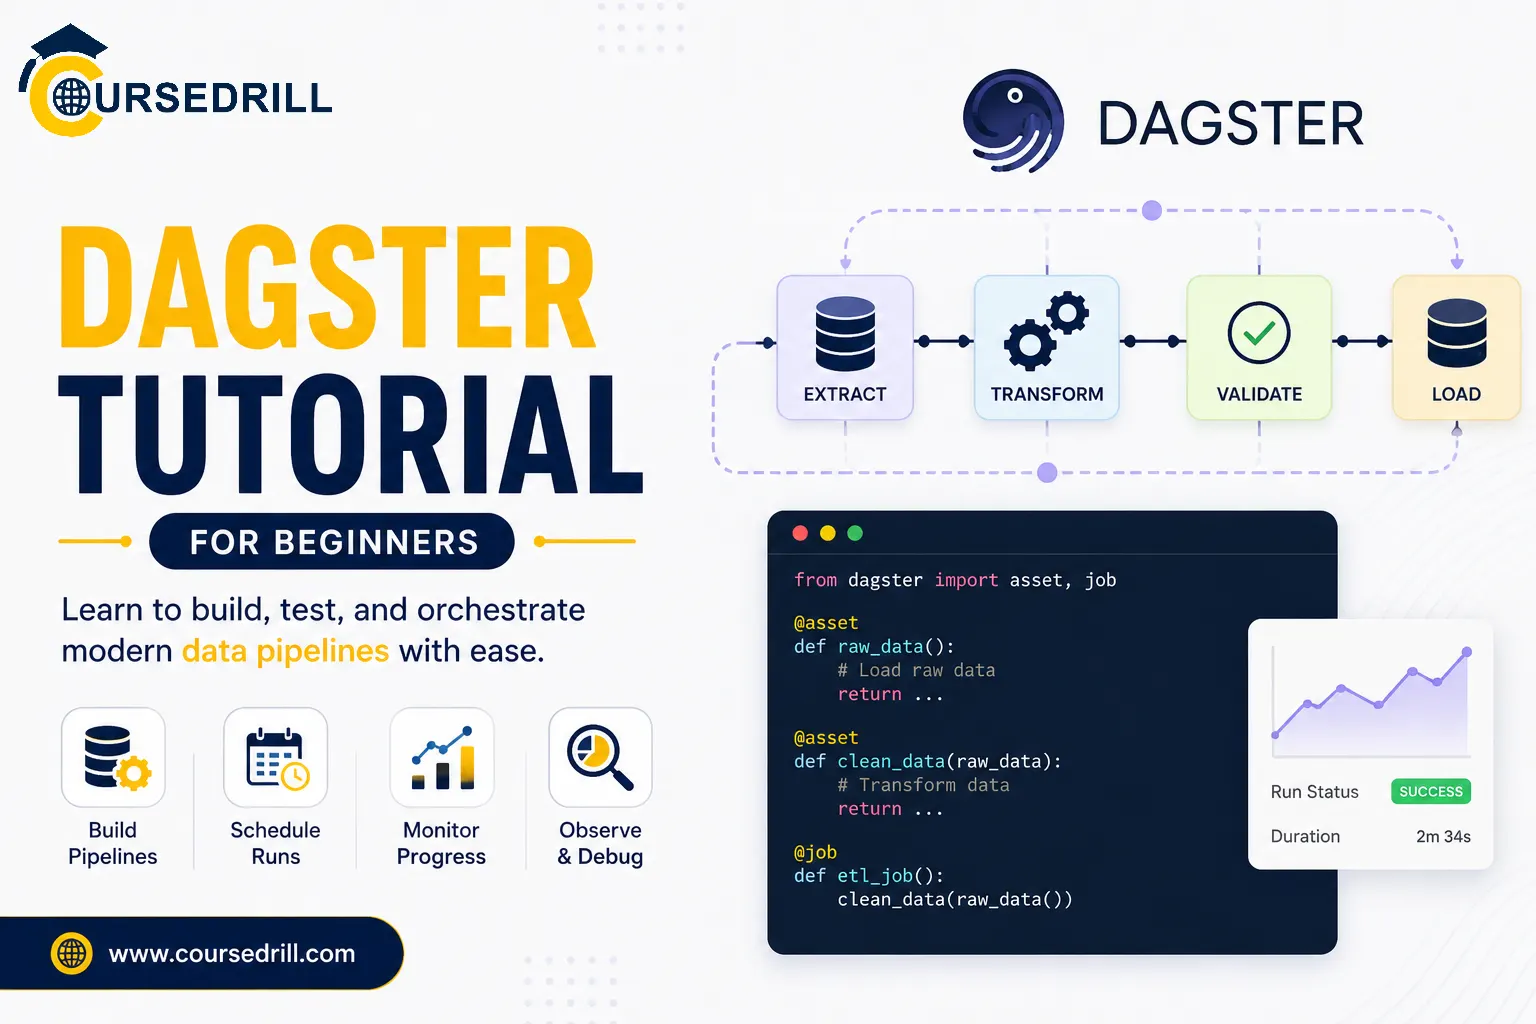
If you’ve been wrangling brittle cron jobs and tangled Airflow DAGs just to move data from one place to another, Dagster is worth your attention. This Dagster tutorial for beginners will get you from a blank folder to a working, testable data pipeline, understanding exactly what’s happening at each step along the way.
Dagster is an open-source orchestrator built specifically for data pipelines. Where a general-purpose workflow engine treats every task as an opaque function, Dagster is built around the idea of data assets: the actual tables, files, and datasets your pipeline produces. That focus on assets, rather than just task execution, is what sets Dagster apart from older orchestration tools, and it’s the concept this tutorial is built around.
What You’ll Need Before Starting
This tutorial assumes basic Python familiarity and comfort with the command line. No prior orchestration experience is required.
You’ll need:
- Python 3.9 or later
- pip, or a tool like Poetry if you prefer managing dependencies that way
- A code editor
- About 30 minutes
Step 1: Installing Dagster
Every Dagster tutorial has to start somewhere, and this one starts with a clean virtual environment. Create a project folder and a virtual environment:
mkdir dagster-tutorial
cd dagster-tutorial
python3 -m venv venv
source venv/bin/activate
Now install the core Dagster package along with the webserver, which powers Dagster’s UI:
pip install dagster dagster-webserverThis gives you everything needed to define, run, and visually inspect a pipeline locally, without any external services or cloud accounts involved.
Step 2: Understanding Dagster’s Core Concepts
Before writing code, it helps to know the vocabulary, since Dagster uses a few terms that differ from other orchestration tools.
Assets are the central concept in modern Dagster. An asset represents a specific piece of data your pipeline produces, a CSV file, a database table, a trained model. Rather than thinking in terms of “run this task, then that task,” Dagster encourages thinking in terms of “produce this dataset, which depends on that dataset.”
Ops are the underlying computational units, individual functions that do work. Assets are typically built on top of ops, though for most beginner and intermediate use cases, you’ll interact with the asset API directly rather than writing raw ops.
Jobs tie a collection of assets or ops together into something you can actually execute and schedule.
Resources represent external systems your code depends on, a database connection, an API client, cloud storage credentials, defined once and reused across your pipeline.
Definitions is the top-level object where you register all your assets, jobs, schedules, and resources so Dagster’s tools know what exists in your project.
Step 3: Writing Your First Asset
Create a file called assets.py. We’re going to build a small pipeline that fetches some raw data, cleans it, and produces a summary, a common beginner-friendly shape for a data pipeline.
import pandas as pd
from dagster import asset

@asset
def raw_orders() -> pd.DataFrame:
    data = {
        "order_id": [1, 2, 3, 4, 5],
        "amount": [25.50, 42.00, 15.75, 108.20, 60.00],
        "region": ["west", "east", "west", "south", "east"],
    }
    return pd.DataFrame(data)

@asset
def cleaned_orders(raw_orders: pd.DataFrame) -> pd.DataFrame:
    df = raw_orders.copy()
    df = df[df["amount"] > 0]
    df["region"] = df["region"].str.lower()
    return df

@asset
def revenue_by_region(cleaned_orders: pd.DataFrame) -> pd.DataFrame:
    return cleaned_orders.groupby("region")["amount"].sum().reset_index()
Notice what just happened. We didn’t manually wire these functions together with explicit “run this after that” logic. Dagster infers the dependency graph directly from the function signatures: because cleaned_orders takes raw_orders as a parameter, Dagster knows raw_orders must run first. Because revenue_by_region takes cleaned_orders, it knows that dependency too.
This is the core idea that makes Dagster feel different from task-based orchestrators. You describe what each asset needs, and the dependency graph builds itself.
Step 4: Registering Your Assets with Definitions
Create a file called definitions.py to tell Dagster what exists in your project:
from dagster import Definitions
from assets import raw_orders, cleaned_orders, revenue_by_region

defs = Definitions(
    assets=[raw_orders, cleaned_orders, revenue_by_region]
)
This Definitions object is what Dagster’s tools look for when loading your project, whether you’re running the UI locally or deploying to production later.
Step 5: Launching the Dagster UI
With your assets defined, start the Dagster webserver:
dagster devOpen http://localhost:3000 in your browser. You’ll see the Dagster UI, often called Dagit, showing your three assets as a connected graph: raw_orders feeding into cleaned_orders, which feeds into revenue_by_region. This visual graph is one of Dagster’s strongest beginner-friendly features, since it makes the shape of your pipeline immediately obvious without reading through code.
Click “Materialize all” in the UI. This tells Dagster to actually execute your assets in dependency order. Once it finishes, click into any individual asset to see its metadata, run history, and the actual data it produced.
Step 6: Materializing Assets from the Command Line
The UI is great for exploration, but you’ll often want to trigger runs programmatically or from a script. You can do that too:
dagster asset materialize --select "*" -m definitionsThis materializes every asset in your project, in the correct dependency order, without touching the browser at all. This is the command you’d typically wire into a CI pipeline or a deployment script.
Step 7: Adding a Schedule
Real pipelines usually need to run on a recurring basis, hourly, daily, or on some custom cadence. Dagster handles this with schedules. Update definitions.py:
from dagster import Definitions, ScheduleDefinition, define_asset_job
from assets import raw_orders, cleaned_orders, revenue_by_region

daily_job = define_asset_job("daily_orders_job", selection="*")

daily_schedule = ScheduleDefinition(
    job=daily_job,
    cron_schedule="0 6 * * *",
)

defs = Definitions(
    assets=[raw_orders, cleaned_orders, revenue_by_region],
    jobs=[daily_job],
    schedules=[daily_schedule],
)
This schedule runs the full asset pipeline every day at 6 a.m., using standard cron syntax. Once your Dagster deployment is running (locally through dagster dev, or in production), schedules like this fire automatically without any manual intervention.
Step 8: Adding a Resource for External Connections
Real pipelines rarely pull data from a hardcoded dictionary. They connect to databases, APIs, or cloud storage. Dagster’s resource system keeps those connections clean and reusable. Here’s a simplified example connecting to a database:
from dagster import ConfigurableResource
import sqlite3

class DatabaseResource(ConfigurableResource):
    db_path: str

    def get_connection(self):
        return sqlite3.connect(self.db_path)
You’d then declare this resource in your Definitions object and request it as a parameter in any asset that needs a database connection. This keeps connection logic centralized instead of scattered across every function that happens to need a database.
Step 9: Testing Your Assets
One of Dagster’s underrated strengths for beginners is how straightforward testing becomes, since assets are just Python functions. You can call them directly in a test:
from assets import raw_orders, cleaned_orders

def test_cleaned_orders_removes_invalid_rows():
    df = raw_orders()
    result = cleaned_orders(df)
    assert (result["amount"] > 0).all()
Because Dagster assets are ordinary functions under the decorator, you can test them with plain pytest, without spinning up the full orchestrator or any external infrastructure. This is a meaningful advantage over pipeline tools where testing requires a running scheduler or a live environment.
Step 10: Working with Partitions
So far, every time you materialize revenue_by_region, Dagster recomputes the entire dataset from scratch. That’s fine for a small example, but real pipelines usually deal with data that arrives incrementally, a new batch of orders every day, for instance. This is where partitions come in.
A partitioned asset splits its data into discrete chunks, typically by date, and lets you materialize (or re-materialize) one chunk at a time instead of the whole dataset. Here’s how you’d adapt raw_orders to be partitioned daily:
from dagster import asset, DailyPartitionsDefinition

daily_partitions = DailyPartitionsDefinition(start_date="2024-01-01")

@asset(partitions_def=daily_partitions)
def raw_orders_partitioned(context) -> pd.DataFrame:
    partition_date = context.partition_key
    data = {
        "order_id": [1, 2, 3],
        "amount": [25.50, 42.00, 15.75],
        "region": ["west", "east", "west"],
        "date": [partition_date] * 3,
    }
    return pd.DataFrame(data)
Once an asset is partitioned, the Dagster UI shows a calendar-style view where you can materialize a specific day, a range of days, or backfill months of historical data in one action. This becomes essential once you’re dealing with anything resembling a real production dataset, since re-running an entire pipeline from the beginning just to fix one bad day of data quickly becomes impractical at scale.
For a beginner project, it’s completely fine to skip partitioning at first. But understanding that it exists, and that Dagster treats it as a first-class concept rather than something bolted on, will save you a painful refactor later when your pipeline needs to handle historical backfills.
Step 11: Using Sensors to Trigger Runs from Events
Schedules are great when your pipeline needs to run at a fixed time, but plenty of real-world pipelines need to react to something happening, a new file landing in cloud storage, a message arriving on a queue, an upstream system finishing its own job. Dagster handles this with sensors.
Here’s a simple example of a sensor that checks for new files in a directory and triggers a run when it finds one:
from dagster import sensor, RunRequest, SensorEvaluationContext
import os

@sensor(job=daily_job)
def new_file_sensor(context: SensorEvaluationContext):
    watched_dir = "/tmp/incoming_orders"
    seen = context.cursor or ""
    seen_files = set(seen.split(",")) if seen else set()

    current_files = set(os.listdir(watched_dir)) if os.path.exists(watched_dir) else set()
    new_files = current_files - seen_files

    for filename in new_files:
        yield RunRequest(run_key=filename)

    context.update_cursor(",".join(current_files))
This sensor polls a directory on a regular interval (every 30 seconds by default), compares what it sees against what it saw last time using a stored cursor, and kicks off a new run for anything new. Sensors are what let Dagster pipelines behave less like rigid batch jobs and more like reactive systems that respond to real events as they happen.
Step 12: Adding Asset Checks for Data Quality
A pipeline that runs successfully but produces bad data is arguably worse than one that fails loudly, since bad data can silently propagate into dashboards and downstream decisions. Dagster’s asset checks let you validate data quality as a first-class part of your pipeline rather than an afterthought bolted on separately.
from dagster import asset_check, AssetCheckResult

@asset_check(asset=cleaned_orders)
def check_no_negative_amounts(cleaned_orders: pd.DataFrame) -> AssetCheckResult:
    passed = (cleaned_orders["amount"] >= 0).all()
    return AssetCheckResult(
        passed=bool(passed),
        metadata={"min_amount": float(cleaned_orders["amount"].min())},
    )
Once registered in your Definitions object alongside your assets, this check runs automatically whenever cleaned_orders materializes, and its pass/fail status shows up directly in the Dagster UI next to the asset itself. If a check fails, you’ll see it immediately, in context, rather than discovering the problem days later when someone notices a dashboard looks wrong.
Step 13: Understanding Data Lineage and Observability
One advantage of Dagster’s asset-first design becomes obvious once your pipeline grows past a handful of steps: lineage. Because every asset explicitly declares its upstream dependencies through function parameters, Dagster can automatically construct a full lineage graph showing exactly how data flows from raw inputs to final outputs.
In the Dagster UI, clicking on revenue_by_region doesn’t just show you that asset, it shows you the entire upstream chain that produced it, including when each upstream asset was last materialized and whether it succeeded. This matters enormously once something breaks. Instead of manually tracing through code to figure out which upstream table might be stale or broken, you can see the whole dependency chain visually, with materialization timestamps attached to each node.
This kind of built-in observability is one of the more understated reasons data teams move to Dagster from simpler scripting or cron-based approaches. It’s not just that the pipeline runs, it’s that you can actually see and reason about what happened, weeks after the fact, without digging through logs scattered across different systems.
Also Read: what is temporal
Step 14: Deploying Dagster Beyond Your Laptop
Everything so far has run locally through dagster dev, which is perfect for learning and local development but isn’t how you’d run Dagster in production. There are a few common paths once you’re ready to move beyond a laptop.
Self-hosted on Docker or Kubernetes. Dagster provides official Helm charts for Kubernetes deployments, which is the most common production setup for teams already running Kubernetes infrastructure. This gives you full control over scaling, storage, and networking, at the cost of managing that infrastructure yourself.
Dagster+. This is Dagster’s managed, hosted offering, removing the operational overhead of running the control plane yourself. It adds features like built-in CI/CD integration for deploying code changes, role-based access control, and hosted observability dashboards, which larger teams often find worth the additional cost.
A hybrid approach. Many teams run their own compute (where the actual data processing happens) while using Dagster+ for orchestration and monitoring, keeping sensitive data processing inside their own infrastructure while offloading the operational burden of the control plane itself.
Whichever path you choose, the code you write during local development, the assets, jobs, schedules, and resources covered in this tutorial, carries over directly. Production deployment is primarily a question of infrastructure and configuration, not a rewrite of your pipeline logic.
Common Beginner Mistakes
A handful of mistakes show up repeatedly for people new to Dagster.
Forgetting to register new assets in Definitions. If you write an asset but don’t add it to the assets list, Dagster won’t know it exists, and it won’t show up in the UI or materialize.
Not matching function parameter names to upstream asset names. Dagster infers dependencies from parameter names matching asset function names. A typo here silently breaks the dependency graph rather than throwing an obvious error.
Doing heavy computation outside of assets. Code that runs at import time, outside any asset function, executes every time Dagster loads your project, not just when you materialize. Keep expensive logic inside the asset functions themselves.
Confusing ops and assets. Beginners sometimes start with ops because older Dagster tutorials or documentation examples use them. For most modern data pipeline work, starting with the asset API directly is simpler and is what Dagster’s own getting-started materials now emphasize.
Ignoring partitions early on. Partitioning (splitting an asset by date, region, or another dimension) is a more advanced topic, but many real pipelines eventually need it. It’s fine to skip for a first project, but worth knowing it exists before your data grows.
Dagster vs Other Orchestrators (Quick Comparison)
Beginners often ask how Dagster compares to tools they’ve already heard of.
Dagster vs Airflow: Airflow is task-centric and organizes work into DAGs of tasks. Dagster is asset-centric, which tends to map more naturally onto how data teams actually think (“what tables am I producing”) rather than how infrastructure teams think (“what tasks need to run in order”).
Dagster vs Prefect: Prefect is also task and flow-based, with strong support for dynamic, ad hoc workflows. Dagster’s asset model gives you stronger built-in data lineage and observability out of the box, which becomes valuable as a data platform grows.
Dagster vs Temporal: Temporal is a general-purpose durable execution engine built for long-running business processes like order fulfillment or approval flows, not specifically for data pipelines. Dagster is purpose-built for data engineering, with native support for things like data lineage, asset materialization, and partitioned backfills that Temporal doesn’t attempt to provide.
Why Teams Choose Dagster
Pulling together everything covered in this tutorial, here’s what actually makes Dagster worth adopting once you move past a single learning project.
Testable pipelines without infrastructure. Because assets are plain Python functions under a decorator, you can unit test your pipeline logic with pytest, without a running scheduler or any external services, the same way you’d test any other piece of application code.
Built-in data lineage. The dependency graph you get for free, just by writing functions with parameters that reference other assets, is something teams using older orchestration tools often build by hand, if they build it at all.
Data quality as a first-class concept. Asset checks mean data validation lives directly alongside the pipeline logic that produces the data, rather than as a separate, easily forgotten step bolted on afterward.
A UI that actually helps you understand your pipeline. The Dagster UI isn’t just a status dashboard, it’s a genuinely useful tool for understanding dependency structure, debugging failed runs, and inspecting the actual data produced at each step, all without leaving the browser.
A gentle path from local development to production. Everything built during dagster dev on your laptop, the assets, jobs, schedules, sensors, and resources, transfers directly to a production deployment, whether that’s self-hosted Kubernetes or Dagster+. There’s no rewrite required to go from “working on my machine” to “running in production.”
None of this means Dagster is the right tool for every situation. Teams with simple, infrequent scripts might not need a full orchestrator at all, and teams already deeply invested in Airflow may find the migration cost isn’t worth it for an existing, stable pipeline. But for teams building new data infrastructure, especially ones that care about testability, lineage, and data quality from day one, Dagster’s asset-first approach tends to save real time once a pipeline grows past a handful of steps.
Frequently Asked Questions
Do I need to know Airflow before learning Dagster?
No. Dagster is a good starting point on its own, and many teams adopt it without any prior orchestration experience. Its asset-first model is arguably more intuitive for beginners than Airflow’s DAG-first approach.
Is Dagster free to use?
Yes, the open-source version of Dagster is free and covers everything in this tutorial. Dagster+ is the managed, paid offering for teams that want hosted infrastructure and additional collaboration features.
What’s the difference between an op and an asset?
An op is a raw unit of computation. An asset represents a specific piece of persisted data and is usually the higher-level abstraction beginners should reach for first, since it more directly maps to the actual outputs a data team cares about.
Can Dagster replace Airflow entirely?
For many teams, yes. Dagster covers scheduling, dependency management, and observability the same way Airflow does, with an asset-centric model layered on top. Some teams run both during a migration period, but Dagster is designed to be a complete replacement, not just a complement.
How do I deploy Dagster to production?
Dagster can be self-hosted on Kubernetes, Docker, or plain infrastructure, or deployed through Dagster+, the managed cloud offering. Production deployment involves additional configuration for persistent storage and distributed execution beyond what dagster dev provides locally.
What is the difference between a schedule and a sensor?
A schedule triggers a run at fixed time intervals using cron syntax, useful when you know exactly when new data should be processed. A sensor triggers a run in response to an external event, a new file arriving, a message on a queue, or a condition detected in another system. Use schedules when timing is predictable, and sensors when your pipeline needs to react to something happening outside a fixed clock.
Do I need partitions for a small project?
No. Partitioning adds real value once you’re dealing with incremental data or need to backfill historical ranges, but a small, single-run pipeline like the one built in this tutorial works perfectly well without it. It’s worth knowing the concept exists so you’re not surprised when a growing project eventually needs it.
Can Dagster integrate with tools like dbt, Spark, or Snowflake?
Yes. Dagster has official integration libraries for a wide range of data tools, including dbt, Spark, Snowflake, BigQuery, and many others. These integrations let you represent tables managed by those tools as Dagster assets, so they show up in the same lineage graph and dependency system as the Python-based assets covered in this tutorial.
How steep is the learning curve compared to writing plain Python scripts?
The asset and function-based API covered here is close enough to plain Python that most beginners are productive within a single sitting. The steeper part of the learning curve comes later, with concepts like partitions, resources, and production deployment, which is exactly why this tutorial introduces them gradually rather than all at once.
Wrapping Up
That covers the essentials of this Dagster tutorial: a beginner’s guide from a blank folder to a running pipeline. You’ve now built a working Dagster pipeline from scratch: three connected assets, a schedule, a resource pattern for external connections, and a basic test. More importantly, you’ve seen the core idea that makes Dagster distinct: describing your data as assets with clear dependencies, rather than a loose collection of tasks that happen to run in some order.
From here, the natural next steps are exploring partitions (for backfilling historical data), sensors (for triggering runs based on external events rather than a schedule), and asset checks (for validating data quality automatically). All of them build on the same foundation you just built here.
For deeper reference material as you keep building, the official Dagster documentation covers partitions, sensors, and production deployment patterns in far more depth than a single beginner tutorial can.
Popular Courses