- Posted on
- admin
- No Comments
OpenTelemetry Architecture Explained
OpenTelemetry architecture explained: API, SDK, instrumentation, the Collector, and OTLP, with a full walkthrough of how telemetry data actually flows.
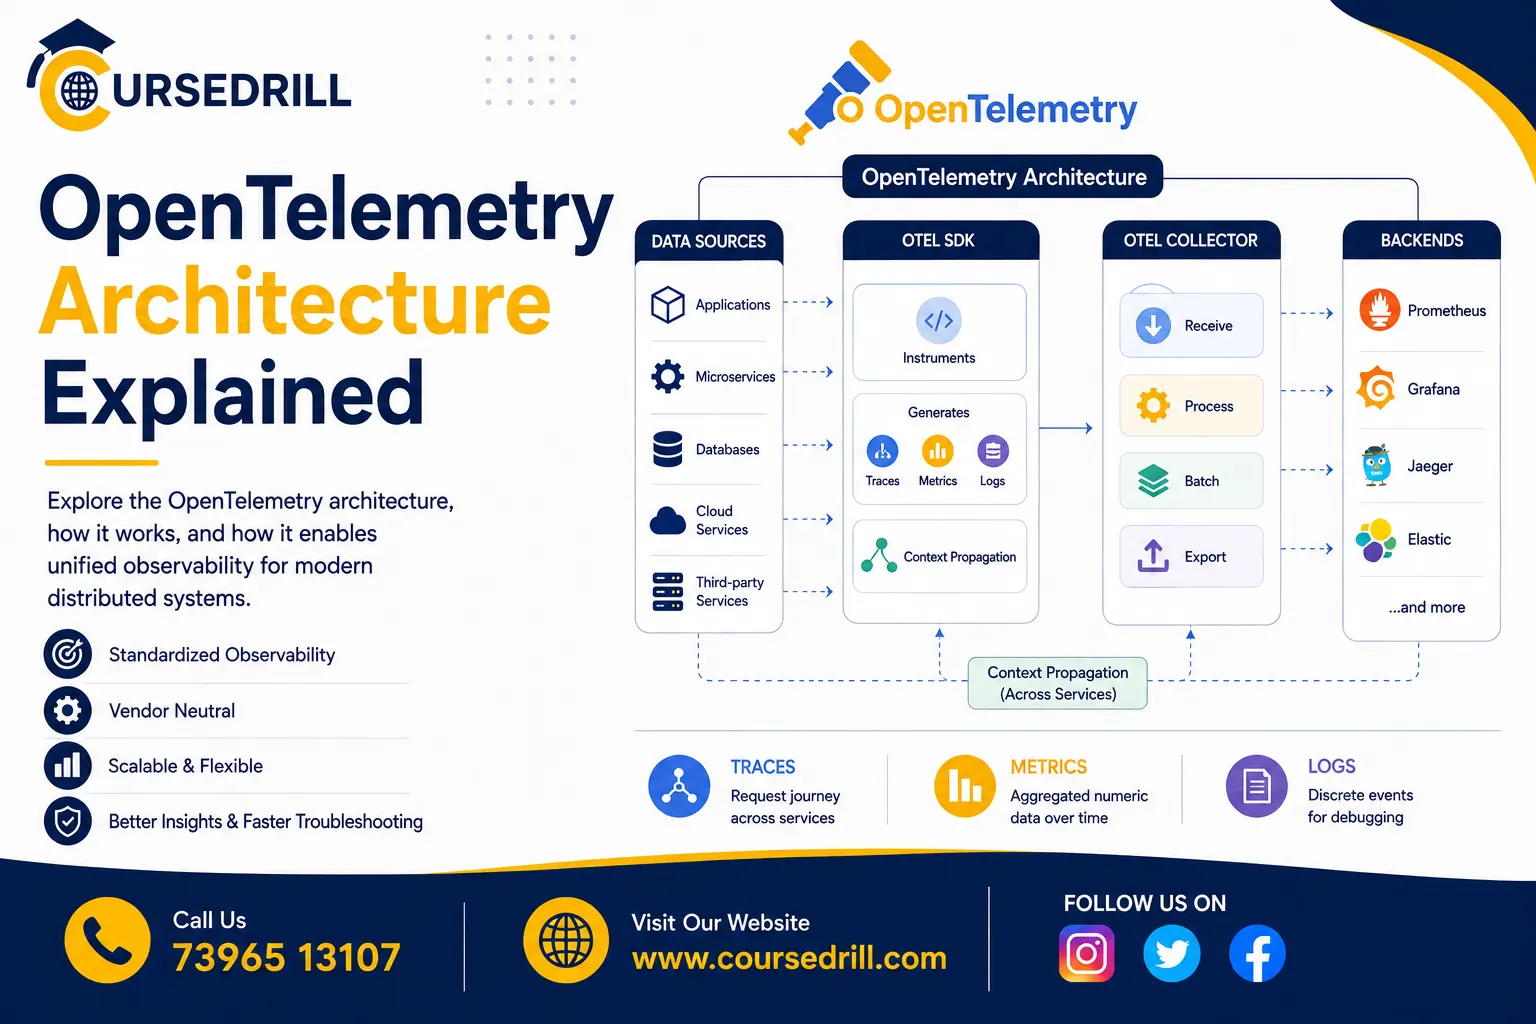
Understanding what OpenTelemetry does is one thing. This OpenTelemetry architecture explainer goes a level deeper: how it’s actually put together, which pieces run where, how data flows from your application to a dashboard, and why the architecture is split into so many distinct layers, is what actually helps when you’re designing a real observability setup. This article breaks down OpenTelemetry’s architecture layer by layer, from the API your code calls directly through to the backend where you finally view a trace.
If you’re brand new to OpenTelemetry itself, our What is OpenTelemetry guide covers the core concepts, traces, metrics, and logs, before diving into architecture here.
Why the Architecture Is Layered
Before walking through each component, it’s worth understanding the design principle behind the whole thing, since it’s the piece of OpenTelemetry architecture people usually skip past and later wish they’d understood earlier. OpenTelemetry deliberately separates concerns into distinct layers, the API you call, the SDK that implements it, the instrumentation that generates data, and the Collector that routes it, rather than bundling everything into a single monolithic library.
This separation exists specifically to avoid vendor lock-in and dependency conflicts. A library author can add tracing support using only the lightweight API, without forcing every application that uses their library to also pull in a specific SDK implementation or backend dependency. An application team can swap out where telemetry data ultimately goes without touching instrumentation code, because the SDK and export configuration are decoupled from the API layer application code actually calls. Understanding this layering is the key to understanding almost every other architectural decision in the project.
Layer 1: The API
At the bottom of your application code sits the OpenTelemetry API. This defines the interfaces for creating spans, recording metrics, and propagating context, things like tracer.start_span() or a counter’s add() method. Critically, the API layer has no real implementation behind it on its own. If no SDK is configured, calls to the API are effectively no-ops, they don’t error out, but they don’t produce any telemetry data either.
This matters most for library and framework authors. A database driver or web framework can add OpenTelemetry instrumentation using only the API, and that instrumentation will work correctly (producing real telemetry) if the application using that library has configured an SDK, or silently do nothing if it hasn’t. This is what allows the broader ecosystem of libraries to ship OpenTelemetry support without forcing a specific implementation or backend choice onto every downstream consumer.
Layer 2: The SDK
The SDK is the actual implementation behind the API. When your application configures an SDK, typically once, near application startup, it’s providing the concrete behavior for everything the API defines: how spans are processed, batched, sampled, and ultimately exported.
The SDK itself is composed of a few key pieces:
Providers (TracerProvider, MeterProvider, LoggerProvider) are the entry points your application configures once, which then supply tracers, meters, and loggers to the rest of your code through the API.
Processors sit between span creation and export, handling things like batching multiple spans together before sending them out (reducing network overhead) or filtering spans based on specific criteria.
Exporters are the final step, actually serializing telemetry data and sending it somewhere, whether that’s directly to a backend or to an OpenTelemetry Collector.
This chain, provider, processor, exporter, is configured once at application startup and then operates transparently in the background as your instrumented code runs, with no further involvement needed from application logic itself.
Layer 3: Instrumentation
Instrumentation is what actually generates telemetry data by calling into the API as your application runs. OpenTelemetry supports two distinct approaches here, and understanding the architectural difference between them matters.
Automatic instrumentation typically works by hooking into common libraries and frameworks at a low level, monkey-patching or wrapping functions in popular HTTP clients, web frameworks, and database drivers so that spans and metrics are generated without any code changes in your own application. In some languages (Java is a notable example), this can even be applied entirely externally through a Java agent attached at startup, requiring zero code changes at all.
Manual instrumentation is application code you write explicitly, calling the API directly to create custom spans, record specific attributes, or track business-specific metrics that automatic instrumentation has no way of knowing about on its own.
Architecturally, both approaches ultimately call the same underlying API layer, they’re just different sources generating calls into it. A well-instrumented production system typically combines both: automatic instrumentation handling the well-understood, repetitive parts of the stack, and manual instrumentation layered on top for anything specific to your actual business logic.
Layer 4: Context Propagation
Context propagation is the architectural mechanism that makes distributed tracing actually distributed. Without it, each service would generate its own isolated spans with no way of knowing they were all part of the same originating request.
Here’s how it works structurally. When a service makes an outbound call, an HTTP request to another service, for instance, the current trace context (a trace ID and the current span ID) gets injected into the outgoing request, typically as HTTP headers following the W3C Trace Context standard. The receiving service extracts that context from the incoming headers and uses it to create its own spans as children of the span that made the call, rather than starting a brand-new, disconnected trace.
This propagation mechanism is what stitches together spans generated independently by a dozen different services, each with no direct knowledge of the others, into a single, coherent trace showing the full path a request took. OpenTelemetry also supports Baggage, a related mechanism for propagating arbitrary key-value context (not just trace IDs) across service boundaries, useful for things like passing a user ID or feature flag state through an entire request chain for use in filtering or analysis later.
Layer 5: The OpenTelemetry Collector
The Collector is a standalone, separately deployed service, distinct from your application’s own process, that sits between your instrumented applications and your final observability backend. Architecturally, it’s built around three component types, assembled into pipelines.
Receivers accept incoming telemetry data, most commonly via OTLP (OpenTelemetry’s own protocol), but the Collector also supports receivers for other formats, letting it ingest data from systems not natively using OpenTelemetry, like Prometheus scrape targets or Jaeger’s native format.
Processors transform data as it passes through the Collector: batching for efficiency, filtering out noisy or irrelevant spans, scrubbing sensitive attributes before export, or adding additional resource metadata.
Exporters send processed data onward to one or more backends, which might be a single destination or several simultaneously, letting you fan out the same telemetry data to multiple tools without any application-level changes.
These three component types are wired together into pipelines, one pipeline per signal type (traces, metrics, logs), each defined as a specific chain of receivers, processors, and exporters through the Collector’s configuration file.
Collector Deployment Patterns
The Collector’s architecture supports a few common deployment patterns, and choosing between them is one of the more consequential decisions in a real production setup.
Agent (sidecar or DaemonSet) pattern. A Collector instance runs alongside each application instance, either as a sidecar container in the same pod, or as a DaemonSet running once per node in a Kubernetes cluster. Applications export telemetry data to their local Collector agent over a fast, local connection, reducing the overhead of exporting directly over the network to a remote backend from within application code itself.
Gateway pattern. A separate, centralized fleet of Collector instances receives telemetry data from many applications (often via their local agents, forming a two-tier setup), applies centralized processing, sampling, and routing, and exports onward to backends. This pattern gives you a single, centralized place to manage export configuration, sampling policy, and data routing rules, without needing to update configuration across every individual application or node.
Most real production deployments combine both: lightweight agent Collectors close to each application for local buffering and reduced network overhead, feeding into a centralized gateway layer that handles the heavier processing and final export logic. This two-tier structure is a deliberate architectural pattern, not an accident, since it balances local performance with centralized operational control.
The OTLP Protocol
OTLP, the OpenTelemetry Protocol, is the standard wire format OpenTelemetry components use to communicate, whether that’s an SDK exporting to a Collector, or a Collector exporting to a backend that natively supports OTLP. It’s defined using Protocol Buffers and supports transport over both gRPC and HTTP, giving implementations flexibility depending on network constraints and language ecosystem conventions.
Having a single, standardized protocol is what allows the entire layered architecture to interoperate cleanly. An SDK written in Go can export to a Collector written in Go, running alongside applications written in Java, Python, and Node.js, all speaking the same OTLP format, without any custom translation logic needed between them. This is a meaningfully different situation from the pre-OpenTelemetry world, where every vendor’s proprietary agent spoke its own incompatible wire format.
Where Resources and Semantic Conventions Fit In
Two concepts sit alongside this architecture, shaping how the data flowing through it is actually structured.
Resources are attached at the SDK level, describing the entity generating telemetry, service name, version, deployment environment, host information. This metadata travels with every span, metric, and log record generated by that SDK instance, letting you filter and group data meaningfully once it reaches a backend, without needing to manually tag every individual span yourself.
Semantic conventions standardize the naming and structure of common attributes across the entire ecosystem, an HTTP status code, a database system name, a Kubernetes pod name, all follow the same defined attribute keys regardless of which language’s SDK generated them. This consistency is what allows Collector processors, backend dashboards, and query tooling to work reliably across a genuinely polyglot system instrumented independently by different teams using different languages.
Sampling in the Architecture
Sampling decisions can happen at different points in this layered architecture, and where a sampling decision is made has real architectural implications.
Head-based sampling happens at the SDK level, at the moment a trace begins, before anything about how that trace will actually turn out (whether it will error, how long it will take) is known. This is computationally cheap and reduces data volume immediately at the source, but it means the decision to keep or discard a trace can’t account for whether that trace turns out to be interesting.
Tail-based sampling happens later, typically at a Collector gateway layer, after an entire trace has been assembled from spans arriving from multiple services. This allows sampling decisions based on actual outcome, keeping all traces that contain an error or exceeded some latency threshold, while sampling down the large volume of normal, uninteresting traces. Tail-based sampling requires more architectural investment, since it needs a Collector layer capable of buffering and assembling complete traces before making a keep-or-discard decision, but it produces far more useful sampled data for debugging actual problems.
A Full Request Walkthrough
Putting all these layers together, here’s what actually happens architecturally when a single user request flows through an instrumented system:
- A request arrives at Service A. Automatic instrumentation, hooked into the web framework, creates a new span through the API, which the configured SDK processes and hands to a local Collector agent via OTLP.
- Service A calls Service B over HTTP. Context propagation injects the current trace context into the outgoing request’s headers before it leaves Service A.
- Service B receives the request, extracts the trace context from the incoming headers, and creates its own span as a child of Service A’s span, again through its own local SDK and Collector agent.
- Both services’ local Collector agents forward their spans (via OTLP) to a centralized gateway Collector.
- The gateway Collector buffers spans until it can assemble the complete trace, applies tail-based sampling to decide whether to keep it, and if kept, exports the full trace to the configured backend.
- The backend stores the trace and makes it queryable, letting an engineer pull up the entire cross-service journey of that original request, both spans, correctly nested, with full timing and attribute data, when investigating a slow or failed request later.
Common Architecture Mistakes
A few architectural missteps show up repeatedly in real deployments, worth flagging directly.
Exporting directly from every application instance straight to a commercial backend, skipping the Collector entirely. This works at small scale but becomes an operational headache as you grow, since every configuration change (a new sampling rule, a new export destination) requires redeploying every application instead of updating a single Collector configuration.
Using only head-based sampling at high traffic volumes without a tail-based layer, resulting in a system that might sample away the exact trace containing an error you need during an incident, purely due to bad luck at the sampling decision point.
Skipping semantic conventions in custom manual instrumentation, inventing your own attribute names for things already covered by standard conventions (like HTTP status codes or database system names). This breaks compatibility with dashboards, processors, and tooling built around the standard attribute names.
Underestimating Collector resource requirements at gateway scale. A gateway Collector handling tail-based sampling needs to buffer entire traces in memory until they’re complete, which can require meaningfully more memory and careful scaling than a simple pass-through agent Collector.
Frequently Asked Questions
Do I need to run my own Collector, or can I export directly to a backend? You can export directly from the SDK to many backends that support OTLP natively, and this is a reasonable starting point for small systems. Most production deployments at any real scale introduce a Collector layer for the operational flexibility and centralized processing described above.
What’s the difference between the API and the SDK? The API defines the interfaces your code calls (start a span, record a metric) with no real implementation on its own. The SDK provides the actual implementation, processing, batching, and exporting the data those API calls generate. This separation lets library authors instrument code without depending on a specific backend or implementation choice.
Is the Collector a single point of failure? It can be, if deployed as a single instance. Production Collector deployments are typically run as a scaled, redundant fleet, particularly at the gateway layer, specifically to avoid this risk, with load balancing distributing incoming telemetry data across multiple Collector instances.
Can different services use different languages and still produce connected traces? Yes, this is one of the core architectural strengths of OpenTelemetry. As long as each service’s SDK correctly propagates and extracts trace context (which all official SDKs implement following the same W3C standard), spans generated by services written in entirely different languages link together correctly into a single trace.
Where does sampling actually reduce cost, at the SDK or the Collector? Head-based sampling at the SDK level reduces cost earliest, since data that’s sampled out is never even sent over the network. Tail-based sampling at a Collector gateway reduces storage and analysis cost at the backend, but still requires receiving and temporarily buffering the full, unsampled data volume at the Collector layer first.
Wrapping Up
That’s OpenTelemetry architecture explained end to end: OpenTelemetry’s architecture is deliberately layered: an API that stays implementation-agnostic, an SDK that provides the real behavior, instrumentation (automatic and manual) that generates the actual data, context propagation that connects spans across service boundaries, and a Collector layer that centralizes processing and export. Each layer exists to solve a specific problem, decoupling instrumentation from backend choice, keeping library dependencies lightweight, and giving operators a single place to manage how telemetry data is processed and routed at scale.
Understanding this layering is what turns OpenTelemetry from an abstract concept into something you can actually design a real production observability setup around, deciding where Collectors should run, how sampling should be split between head and tail-based strategies, and how much processing should happen centrally versus at the edge.
For the conceptual foundation behind this architecture, revisit our What is OpenTelemetry guide, and for the full technical specification of the Collector’s configuration options and available components, the OpenTelemetry Collector documentation is the definitive reference.
Popular Courses